The Tamar Valley National Landscape Doughnut is:
A Visual, multifunctional tool that enables us to work together with partners, landowners and communities to make better decisions and monitor progress towards our vision and legal purpose to conserve and enhance the Tamar Valley National Landscape, in effect, acting as a compass towards all our prosperity.
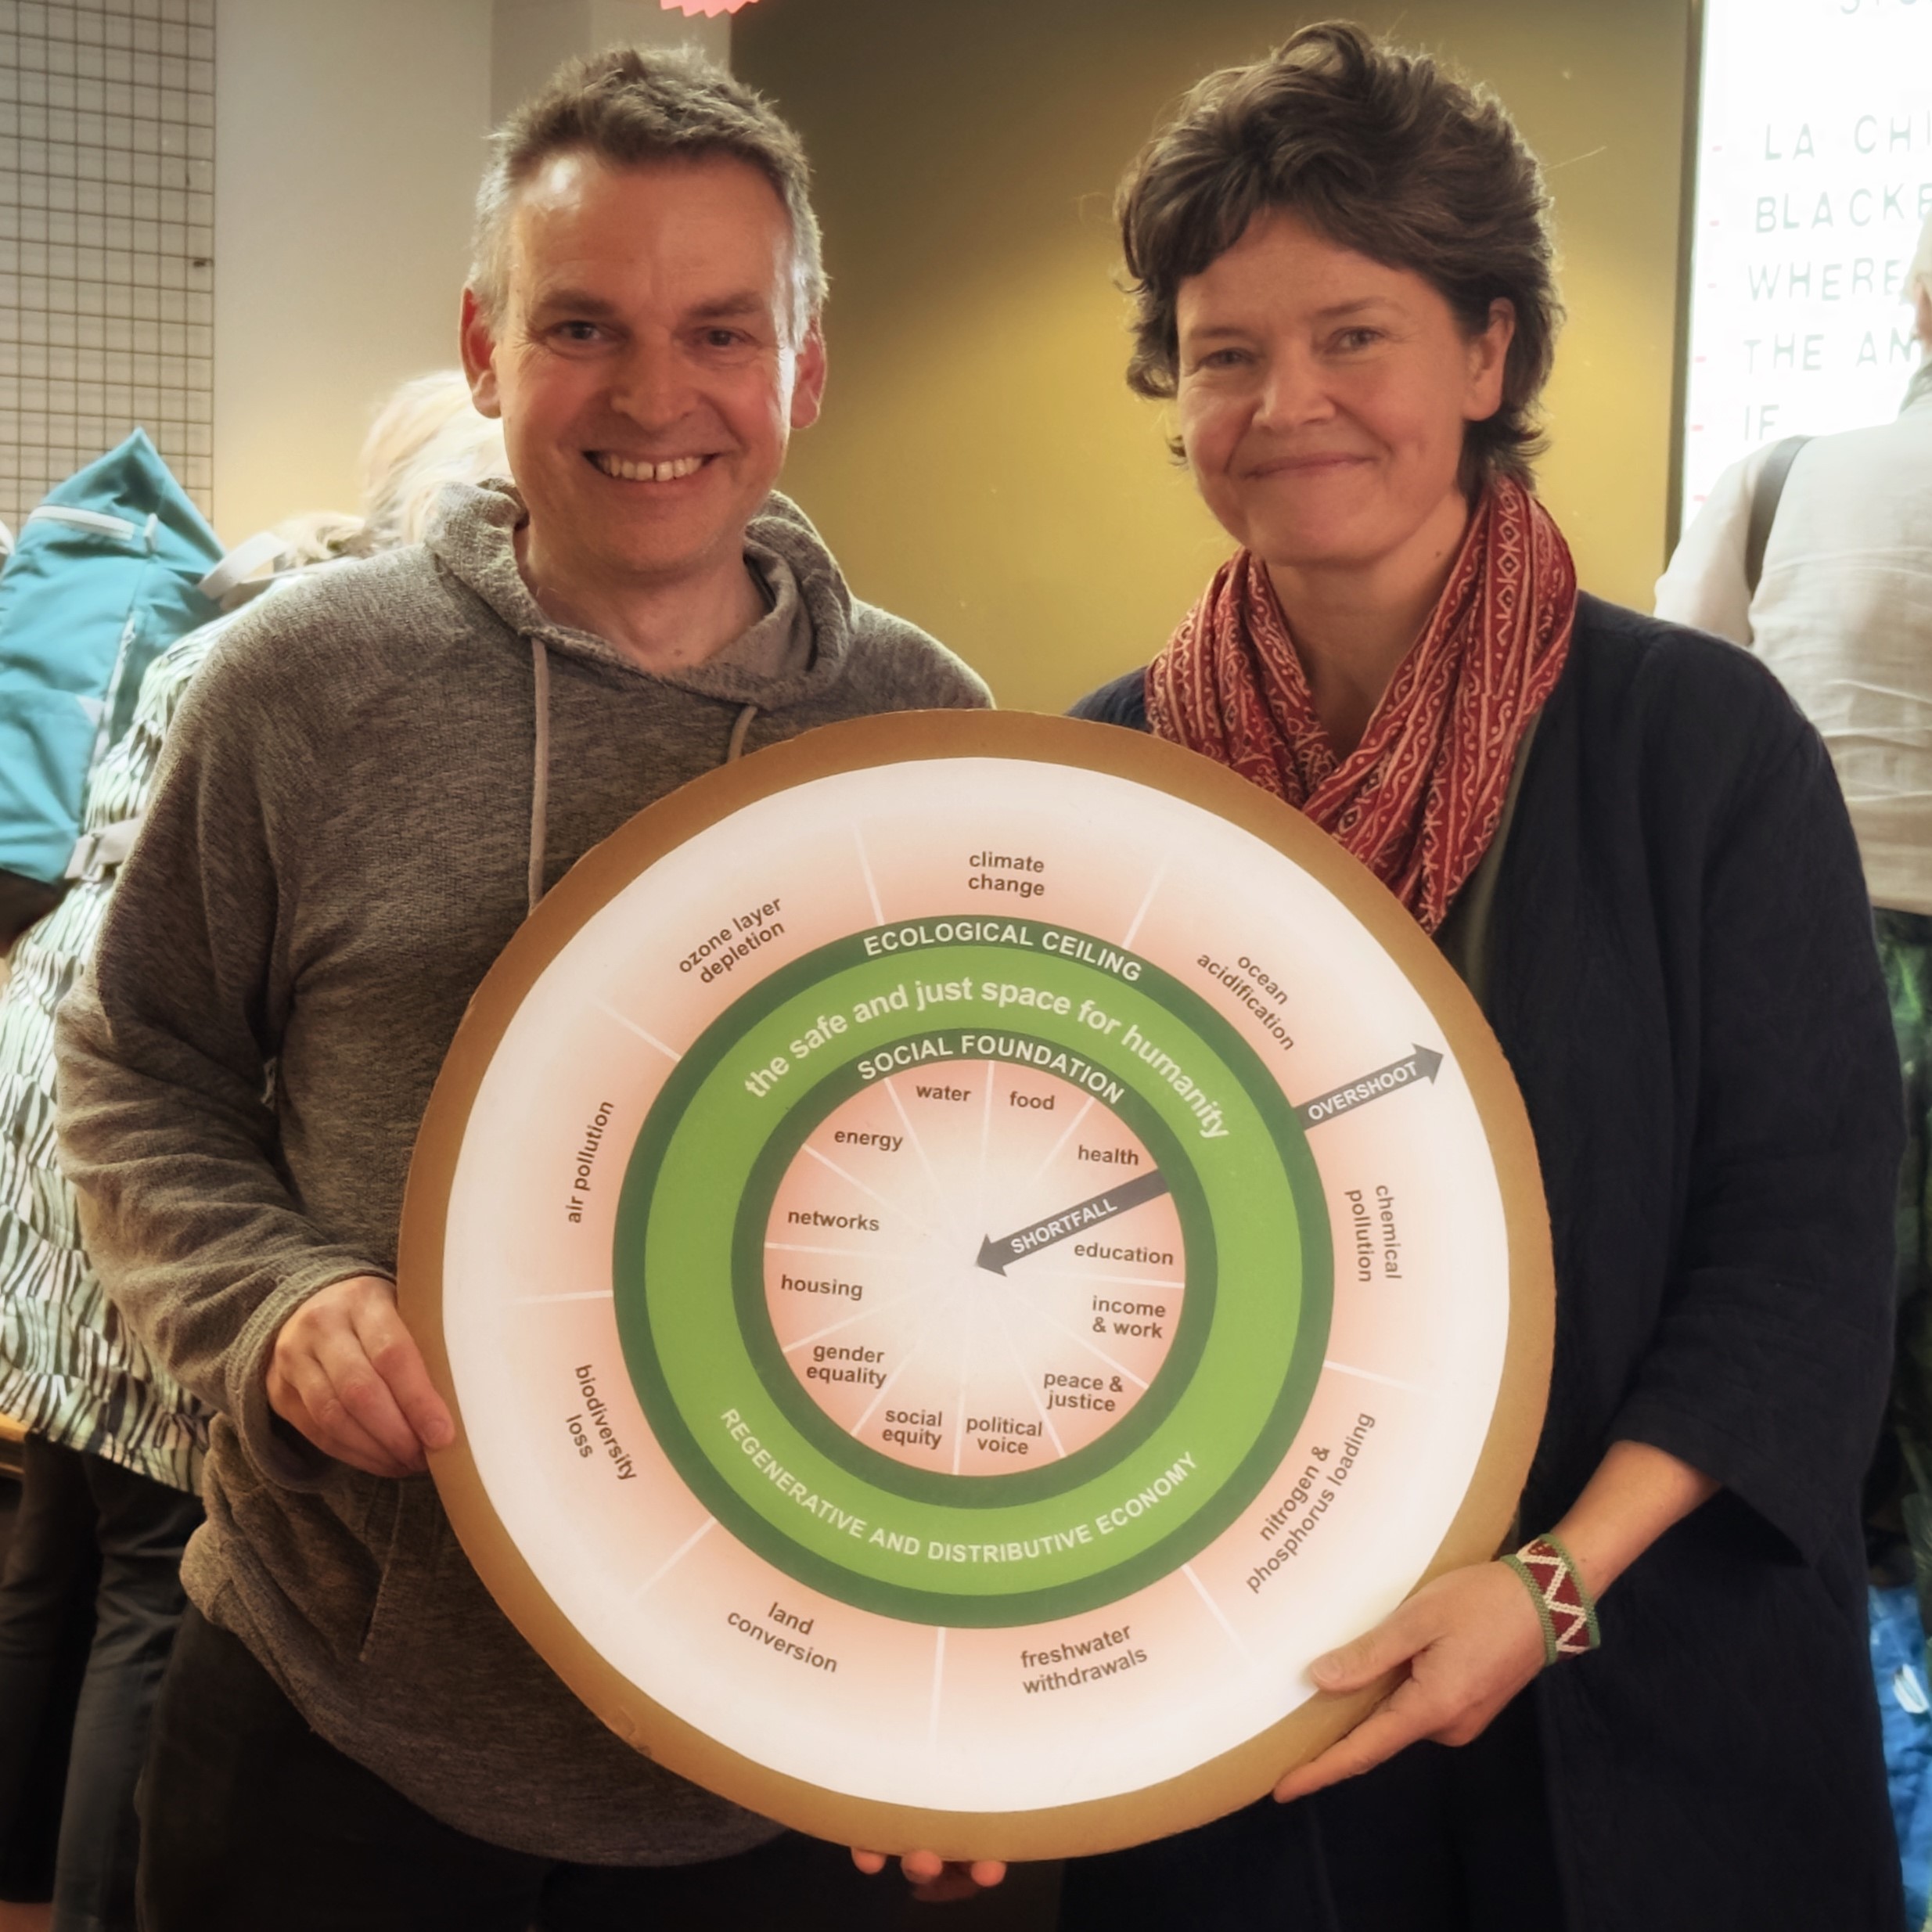
Inspired by the 2009 Rockstrom planetary boundaries model along with further work carried out by Dr Kate Raworth as detailed in her book, Doughnut Economics.
Development was approved by the Tamar Valley Executive partnership in December 2023 and its design has incorporated a number of changes specific for National Landscapes.
Key Benefits
Shared and focused vision.
Better decisions, that consider needs and resources.
Better use of resources, more impact – less waste.
Clear and relevant monitoring and evaluation
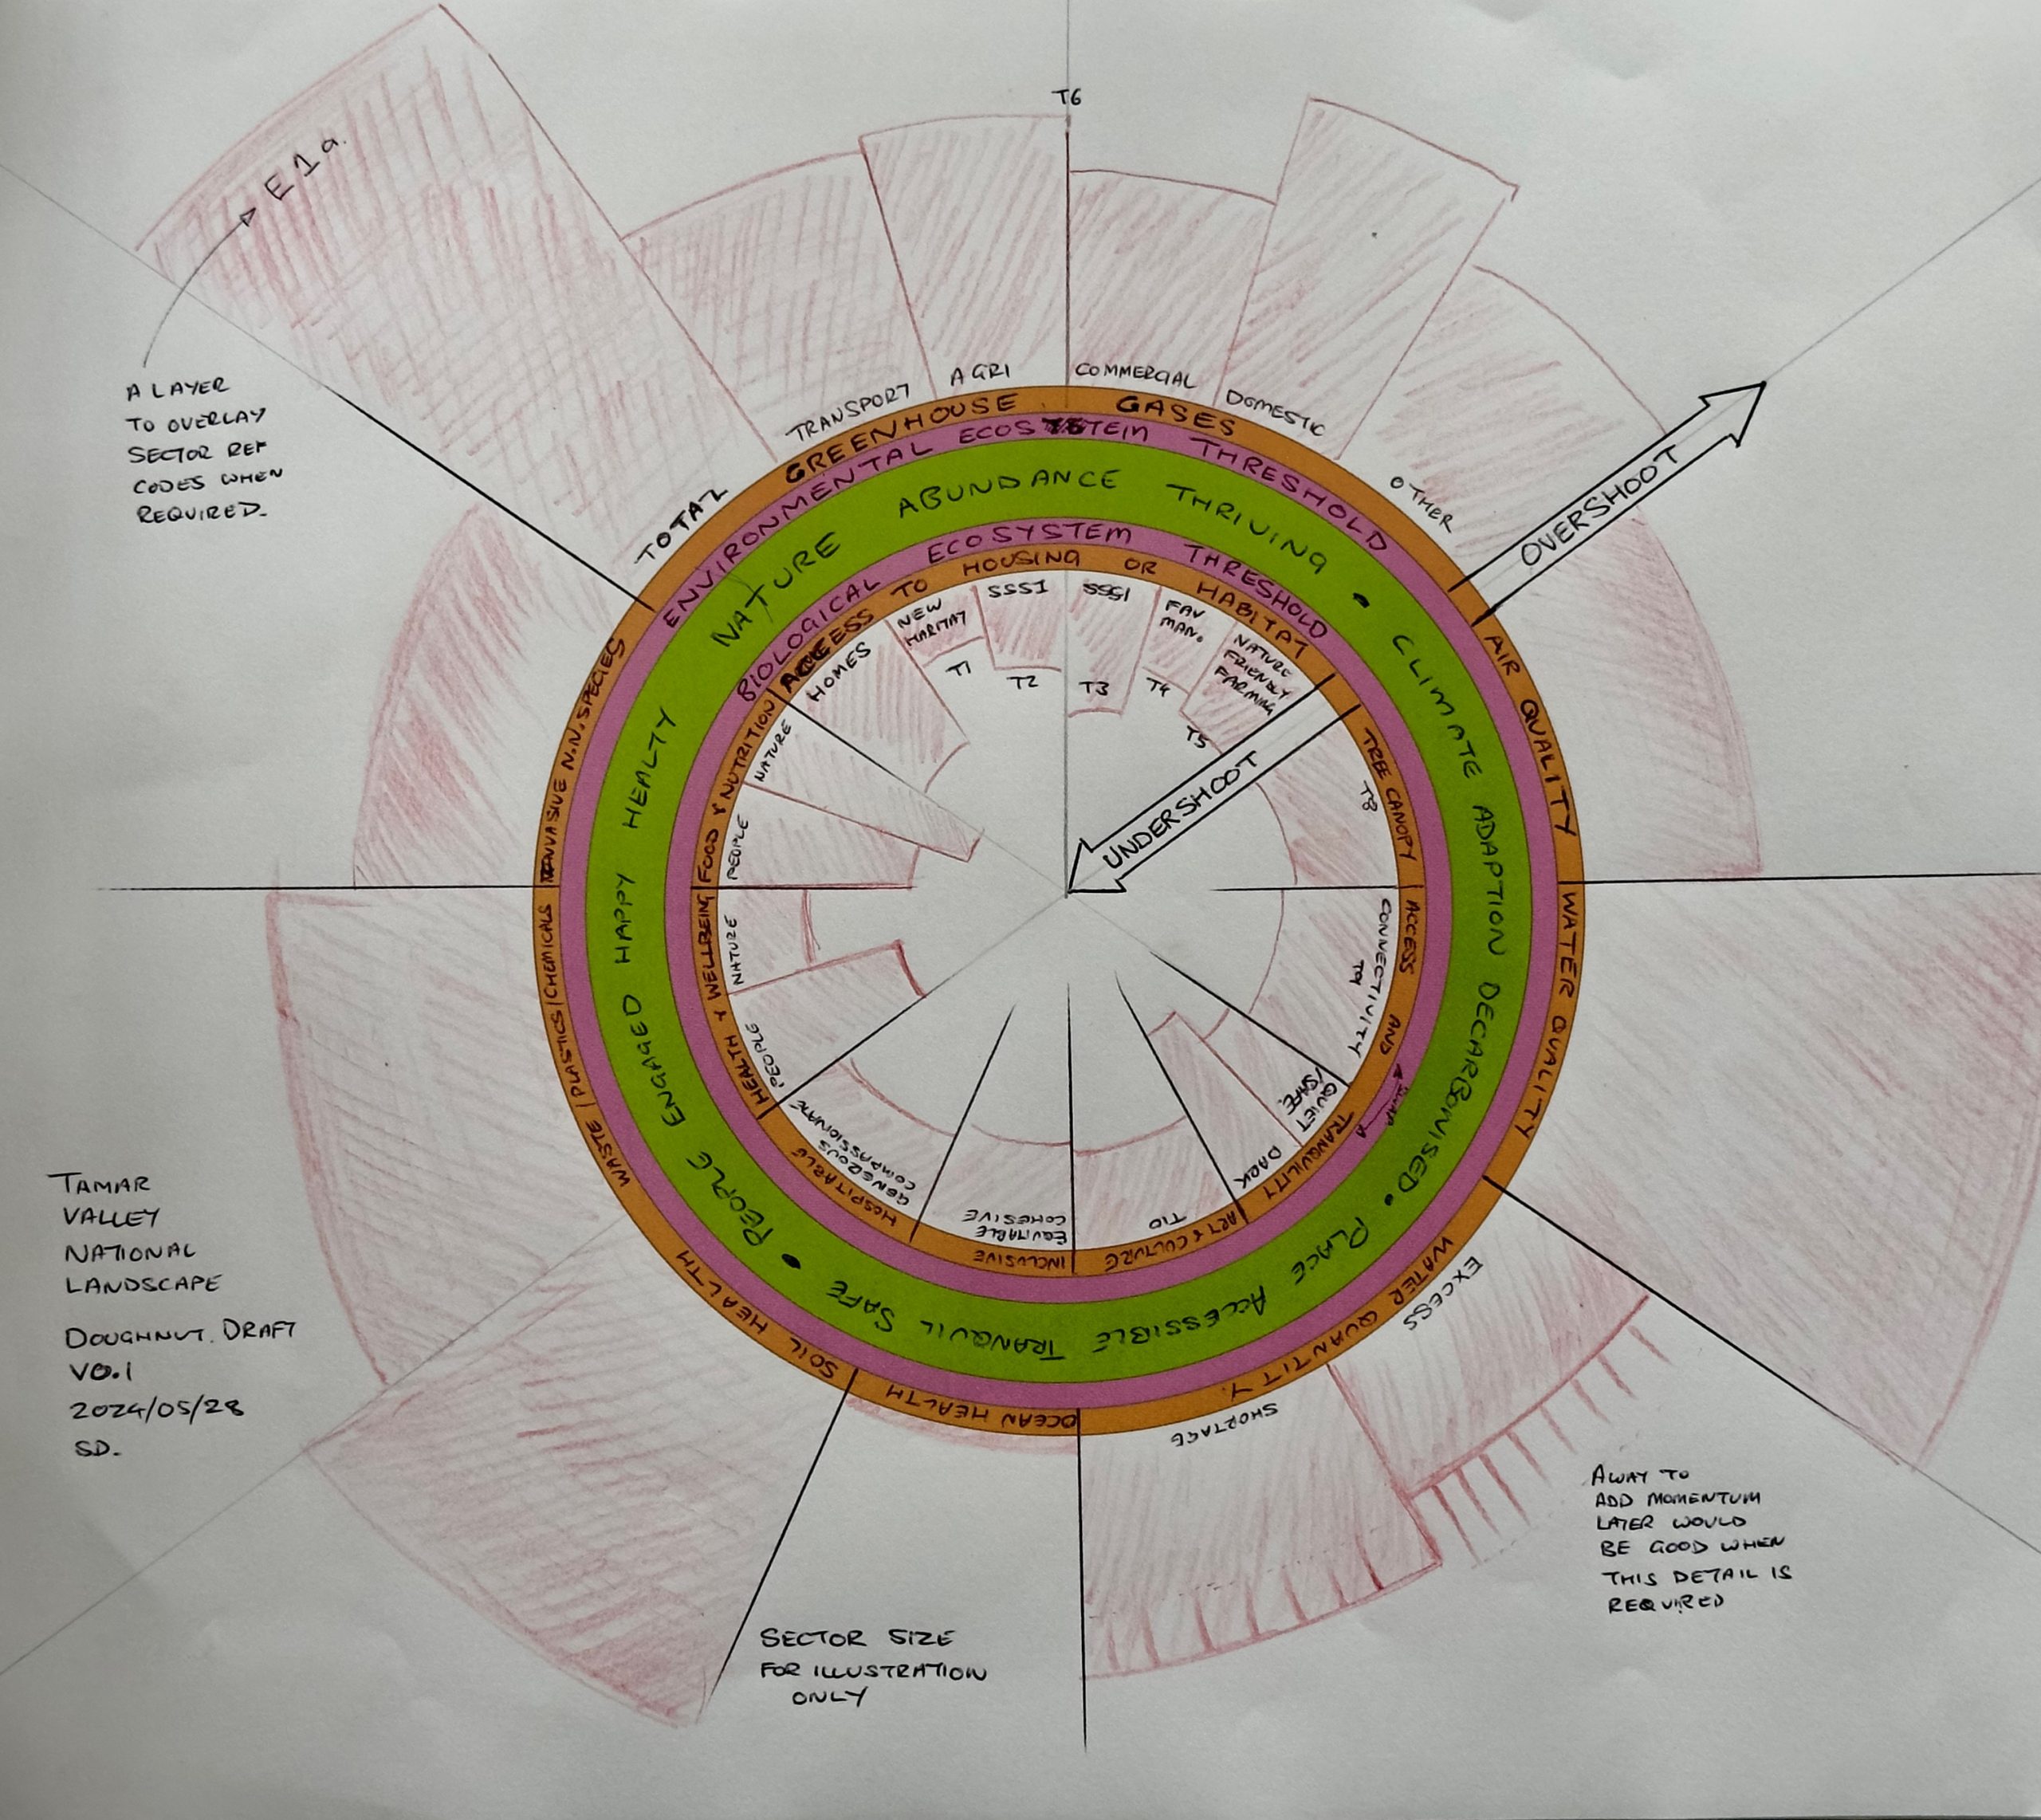
How to Bake a Doughnut
How to Bake a Doughnut
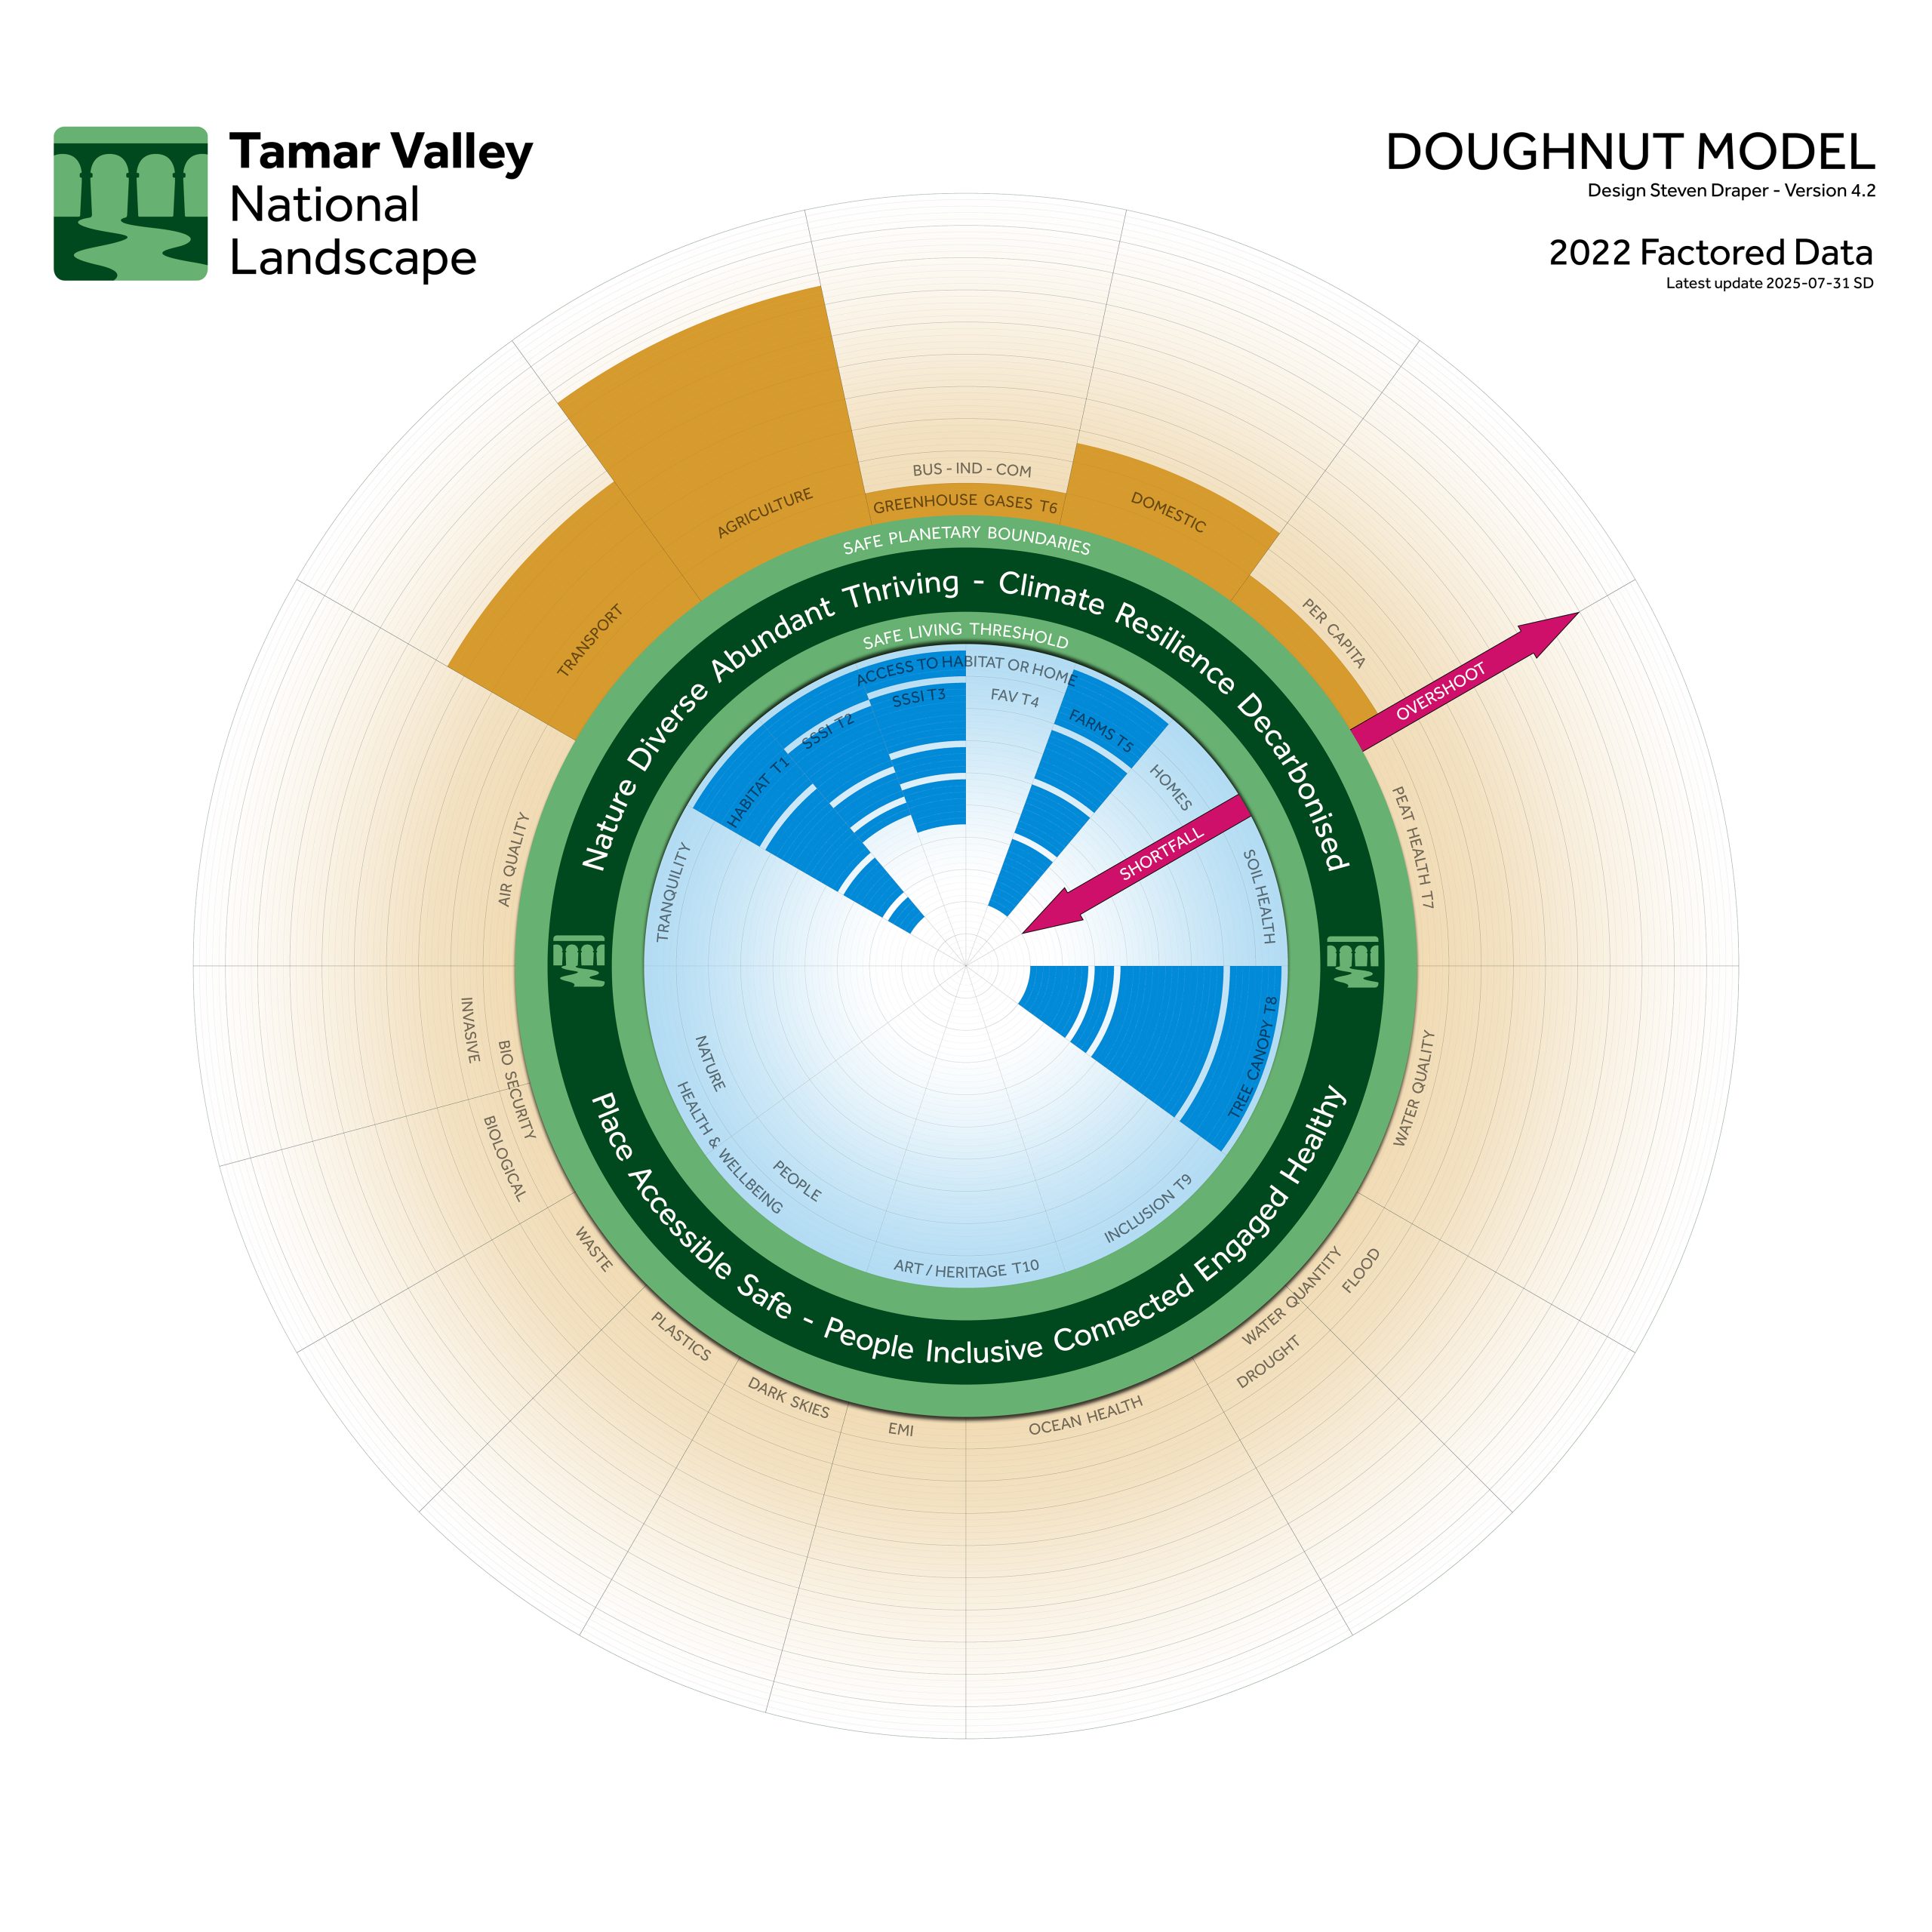
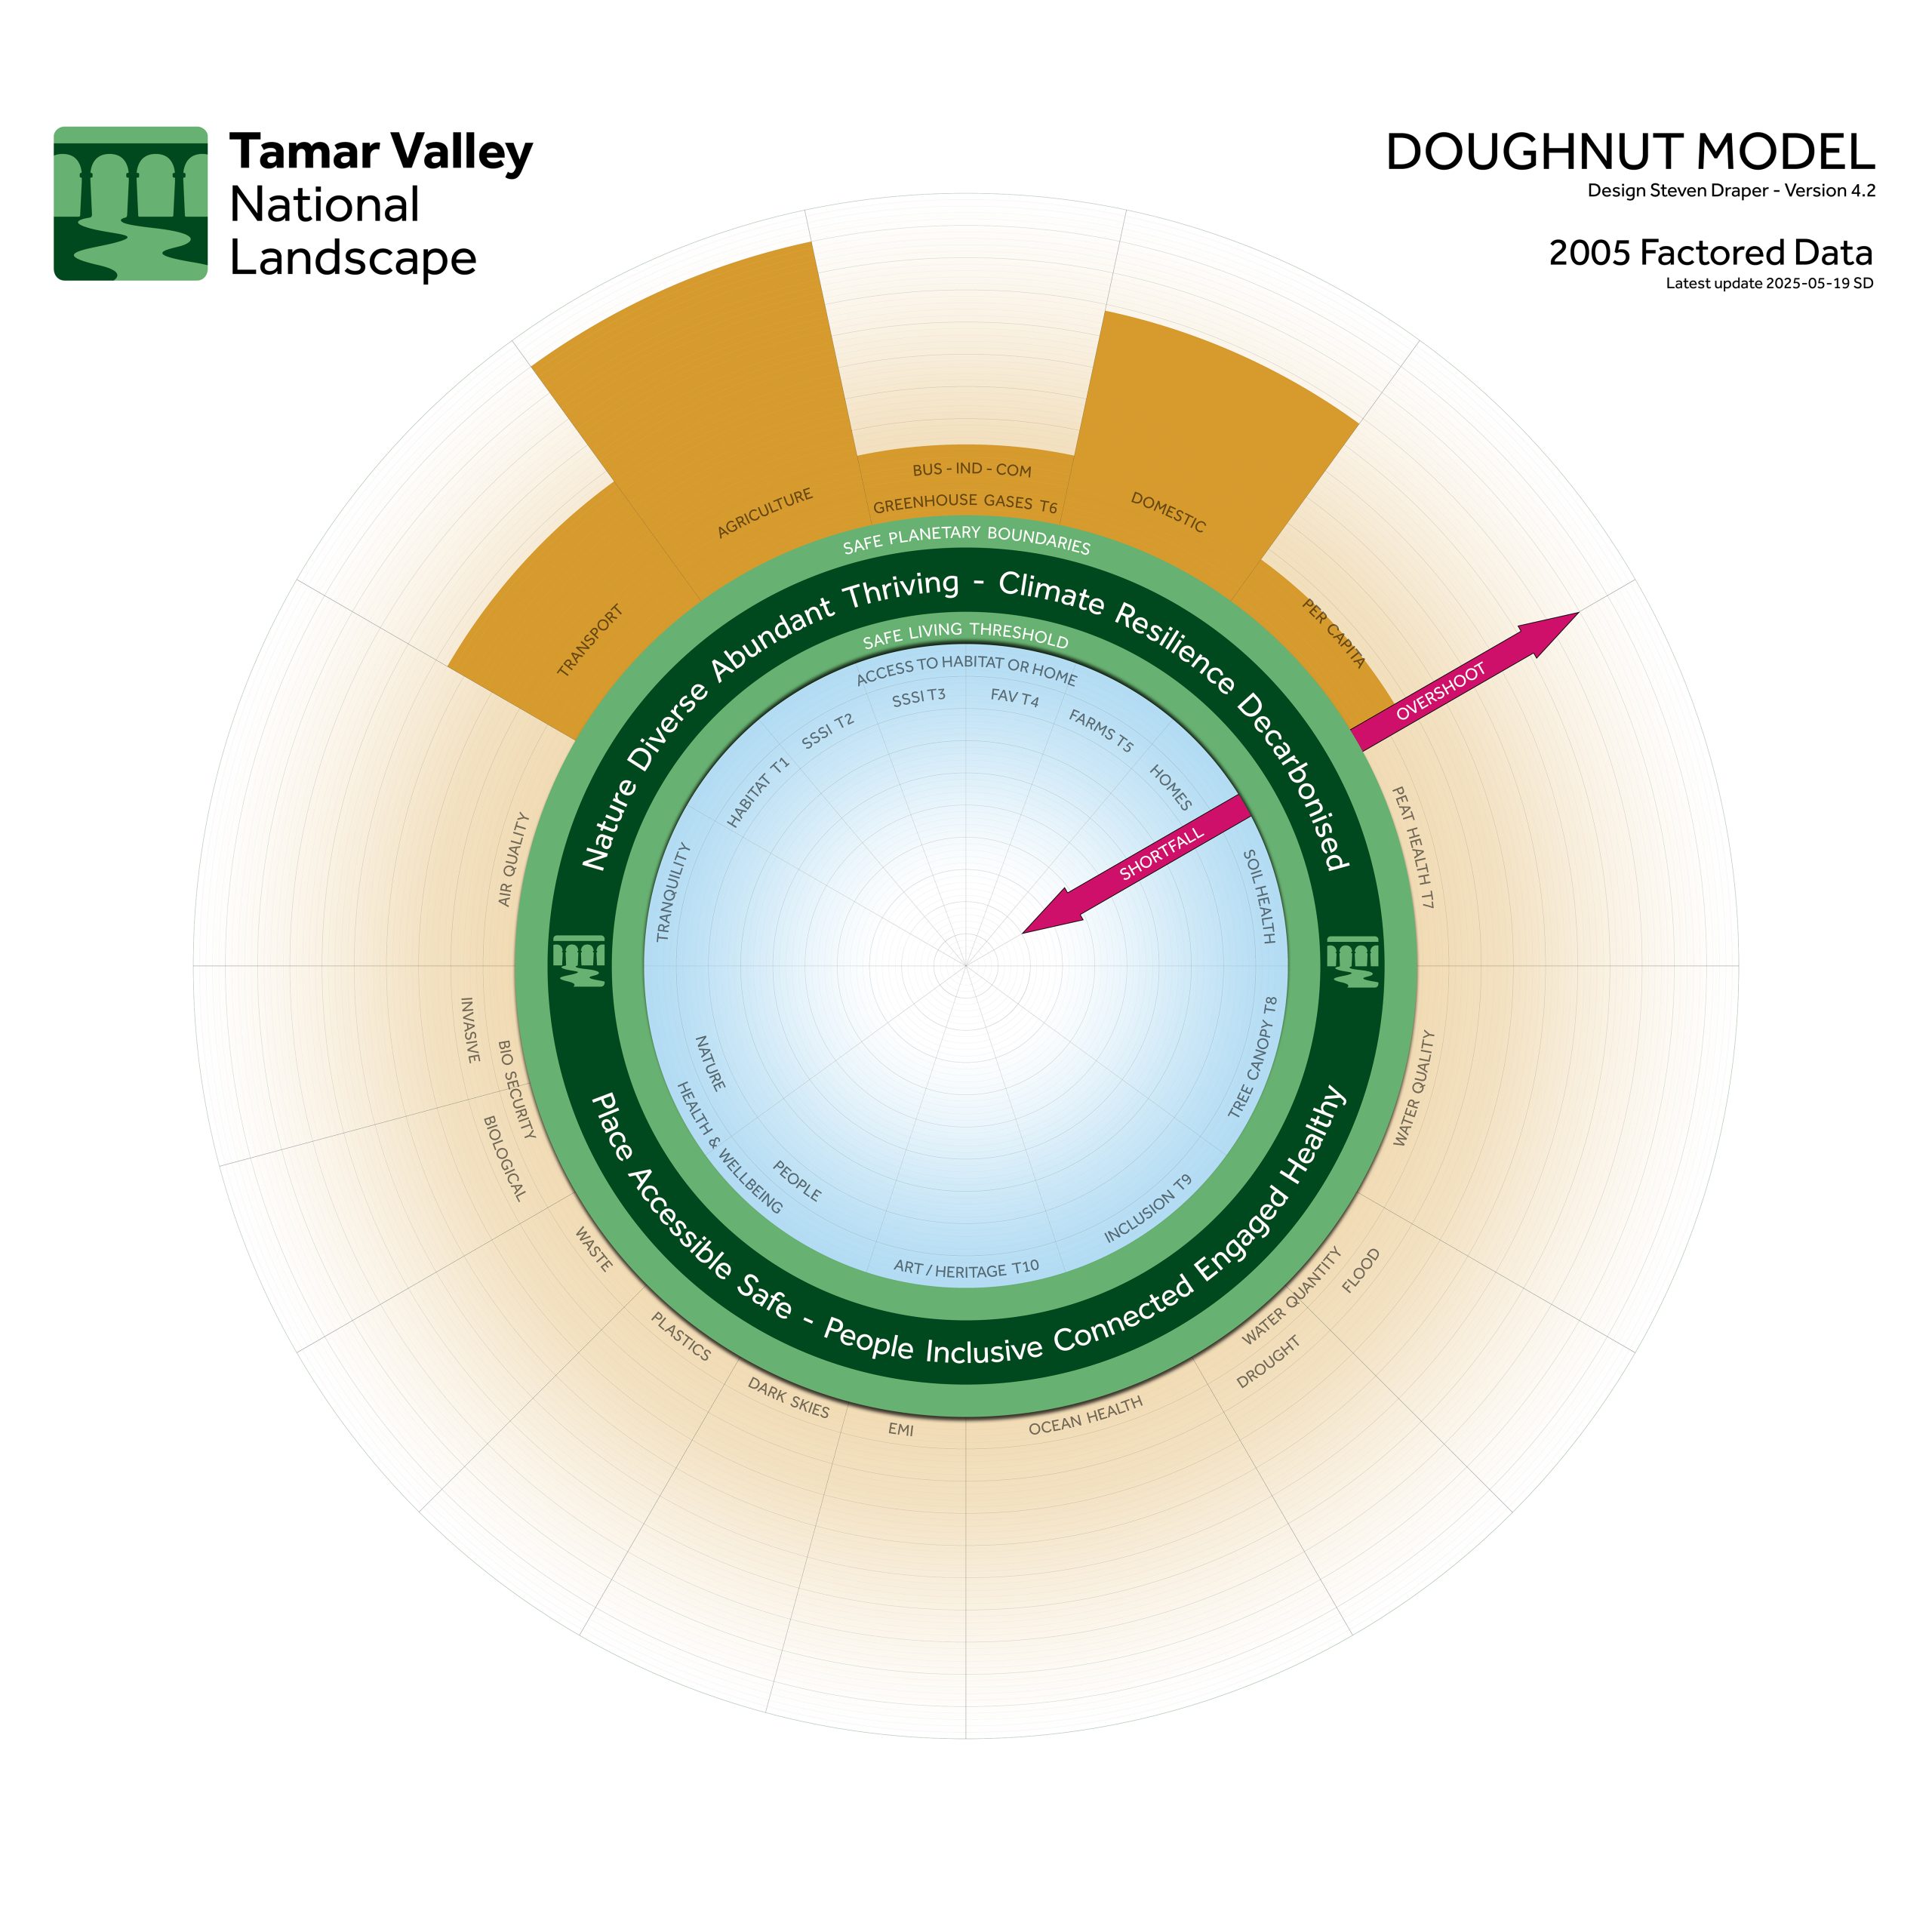
Anatomy of our Doughnut
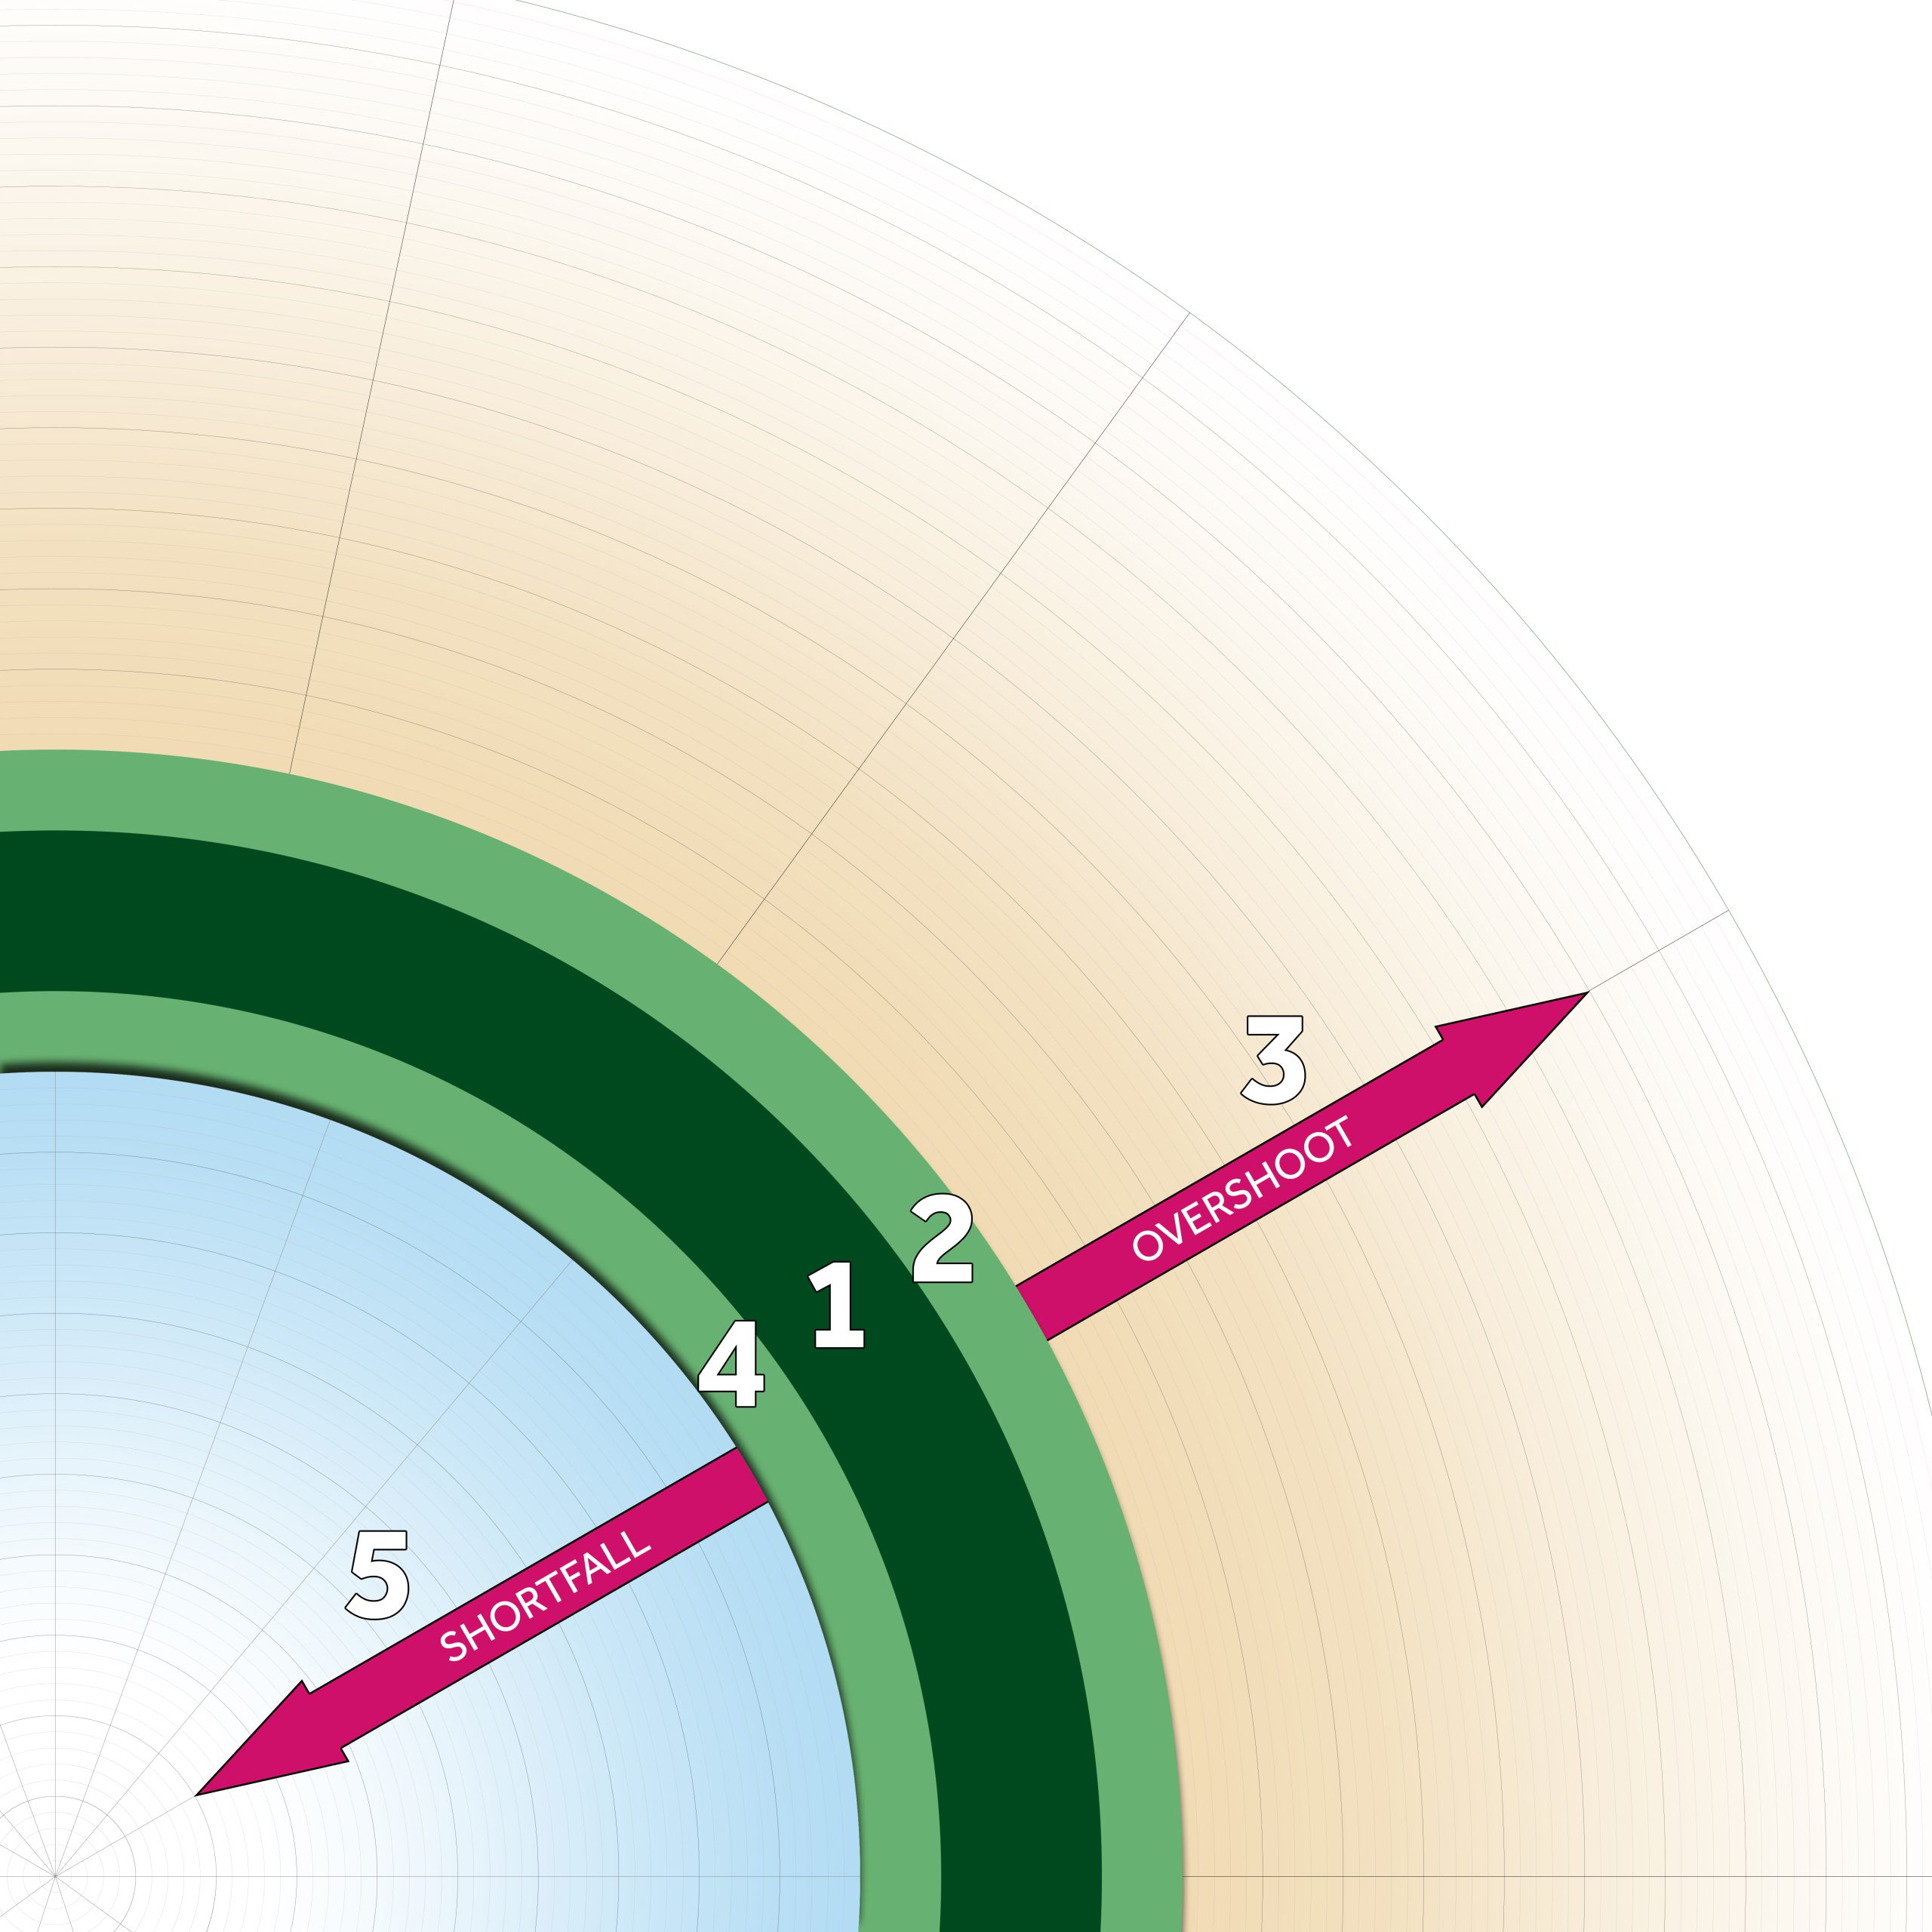
Most doughnuts have five key components.
The central ring of the Doughnut represents our aspirations of ‘A Good Life.’ A safe, regenerated space where planetary resources are distributed to ensure all life has enough, but without exceeding the planets resources / capabilities.
The outer edge represents the safe Planetary Boundaries for environmental systems and resources that would need to be within safe limits to meet our vision.
Exceeding any boundary results in an Overshoot and a sector expanding away from the safe zone.
The inner edge represents safe Living Thresholds, where all life within the Tamar Valley, including humans have enough to thrive.
Undershooting safe levels results in a sector shortfall, extending towards the centre of the doughnut.
The objective is projects delivered by this and future management plans reduce the overshoots and shortfall over time.
Phase 1 – Setting out our Vision Status = Complete and in use
Defining “A Good Place”
Following engagement with partners, including Natural England and Defra, we were able to establish what a thriving Tamar Valley National Landscape would look like. This became the vision of our management plan.
“By 2055, the Tamar Valley National Landscape has a strong sense of place and wellbeing, as a distinctive and internationally important landscape of high visual quality and a protected green and blue haven where communities and wildlife flourish.
Nature and People are entirely connected, enjoying clear air, clean water, wholesome food, good health and resilience to a changing climate and variable economy…”
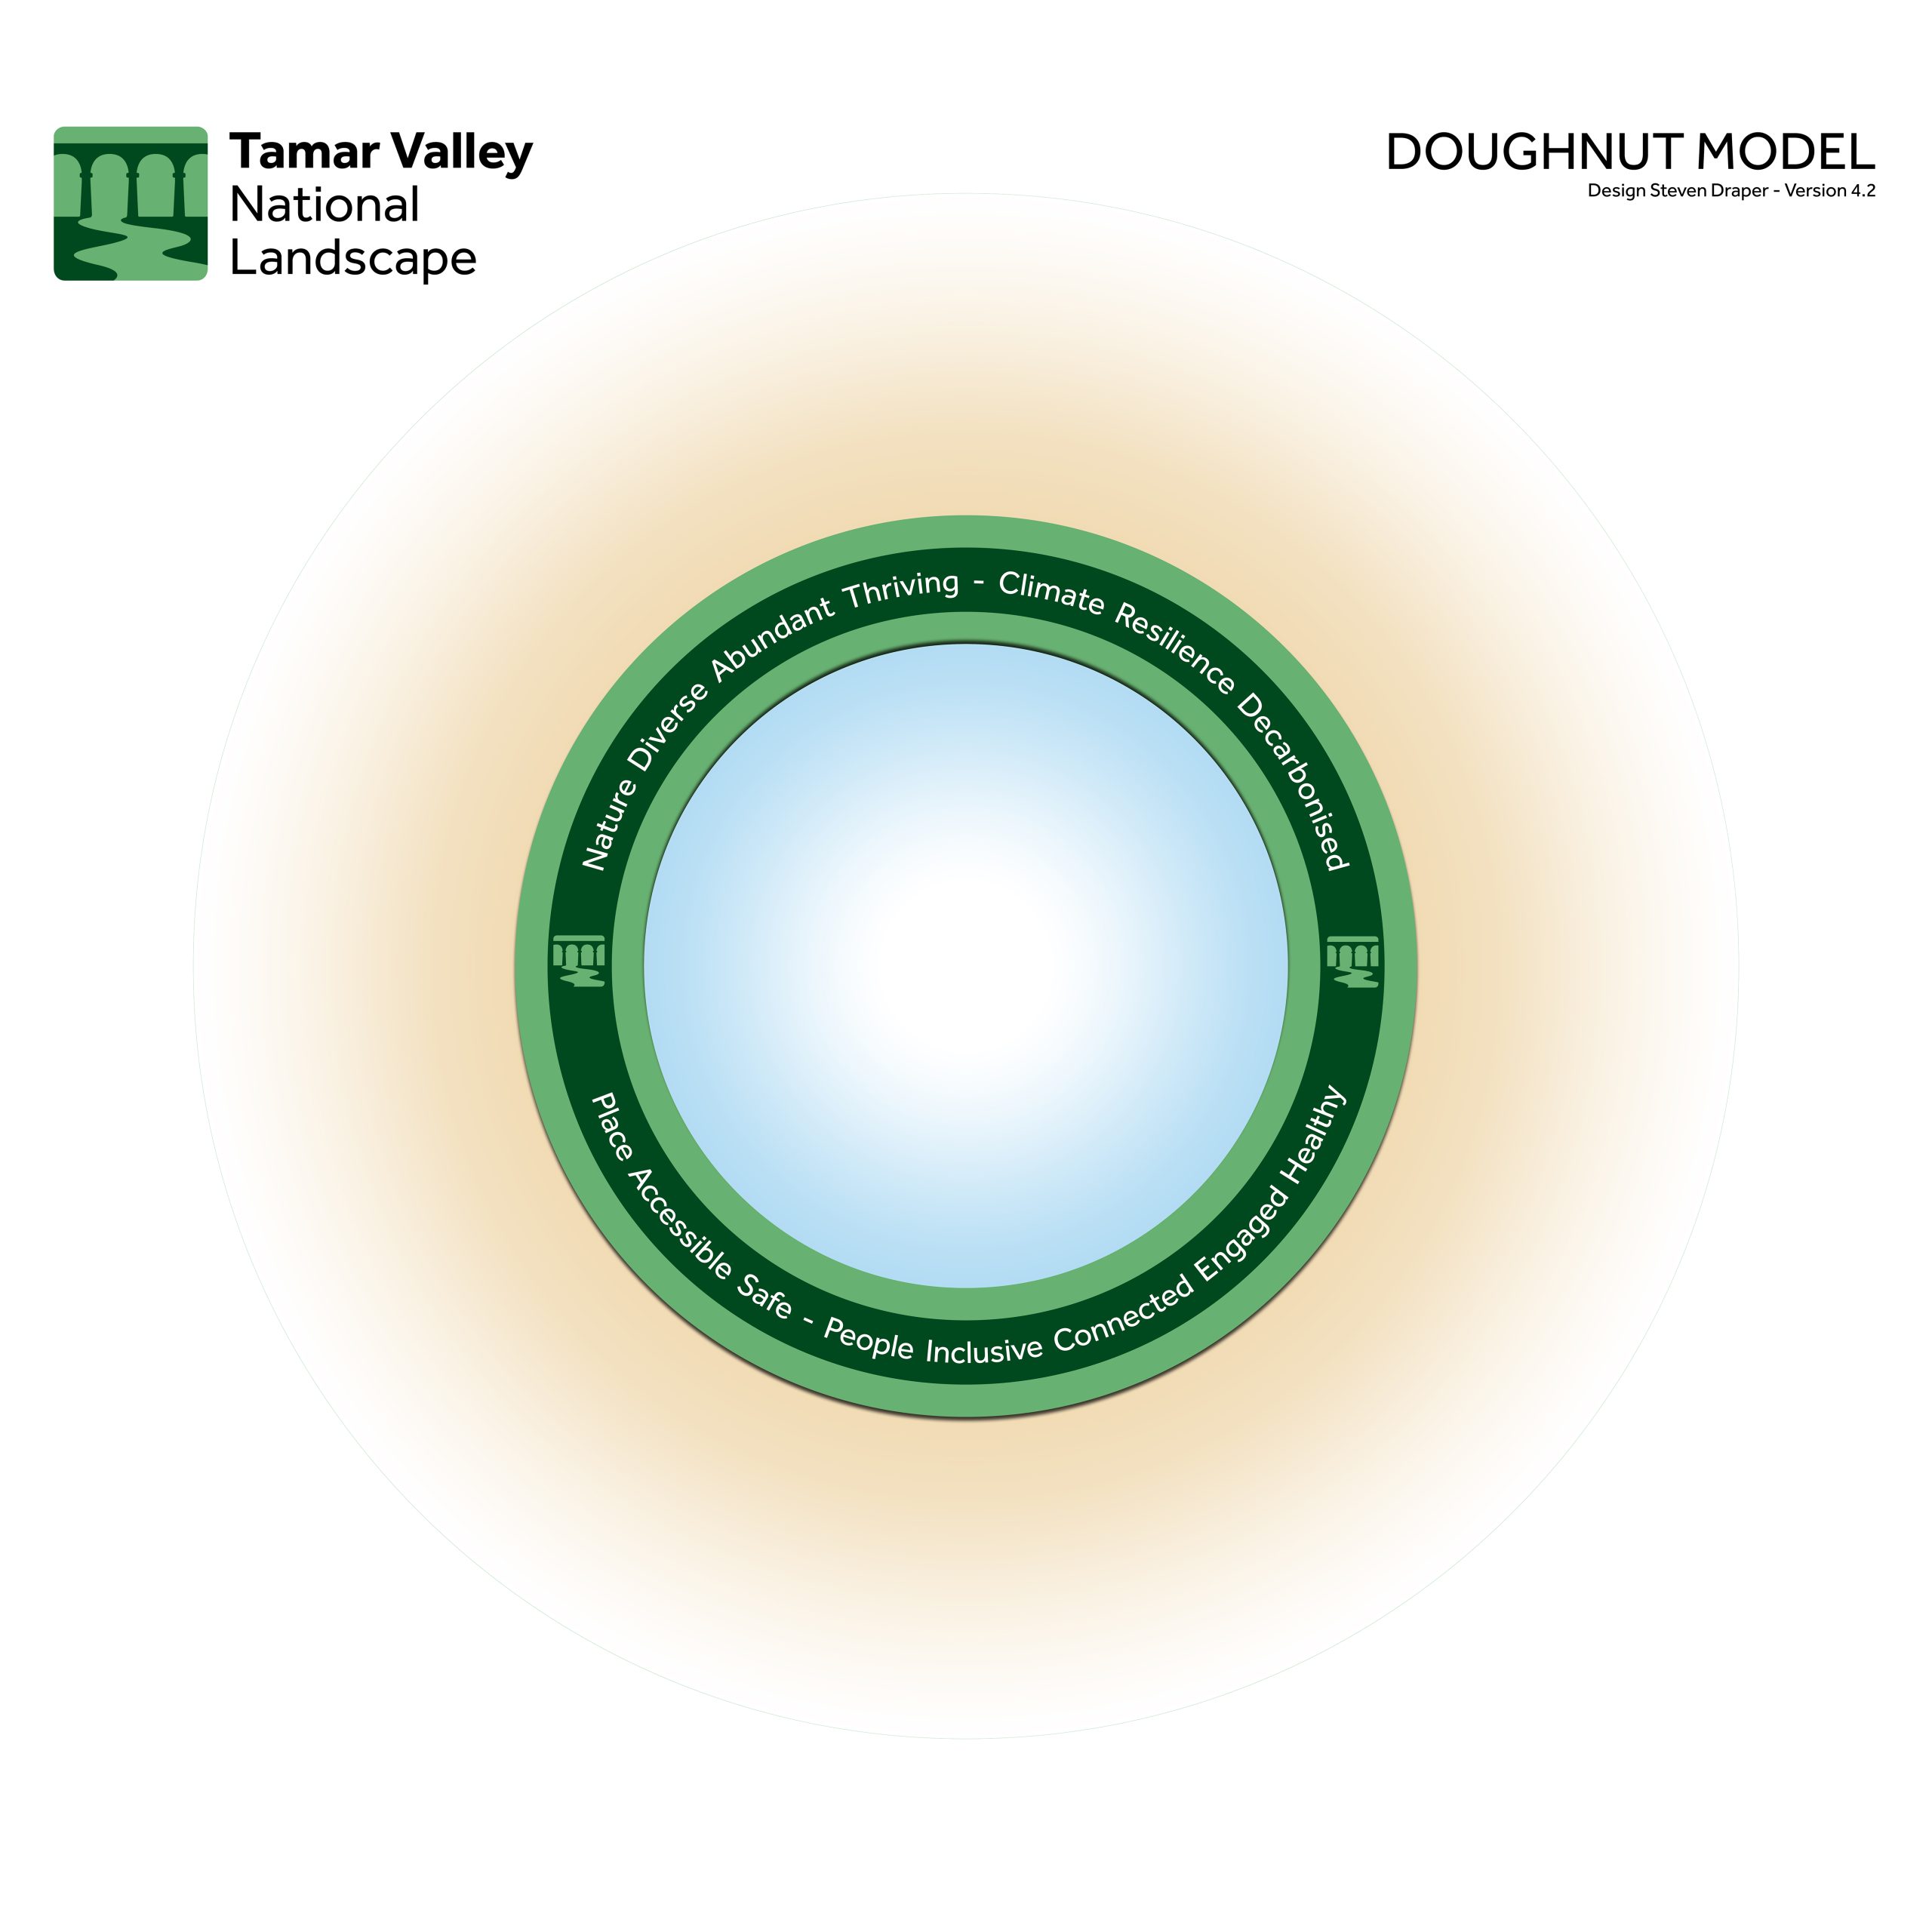
A summary of our vision using key words and themes sits in the safe space in the middle of our doughnut as a reminder of our vision for the Tamar Valley National Landscape.
Actions or decisions can be referenced to the words in the safe space with the question of; Is this moving us towards or away from where we want to be?
It’s very simple application, but when considering or discussing ideas a very powerful way of keeping the direction on track.
Phase 2 – Discussion and Decision wheel – Status = Complete and in use
Maximising Value & Impact, while reducing risk, waste & inefficiency
We identified the key elements that would need to be ‘in balance’ for the Tamar Valley to achieve its vision.
Those which impact planetary systems form segments on the outside of the Doughnut and those impacting the ability for life to thrive form sectors on the inside.
As a National Landscape working together with, landowners, communities and partners to achieve our vision; our decision-making process should be evidence based, justified and transparent. It should ideally identify opportunities for stacking benefits (maximising value and impact) while identifying where a positive action to one sector, may risk a negative impact to another. (reducing waste)
We therefore need to assess the impacts of our decisions at an early stage of any policy development, project or programme.
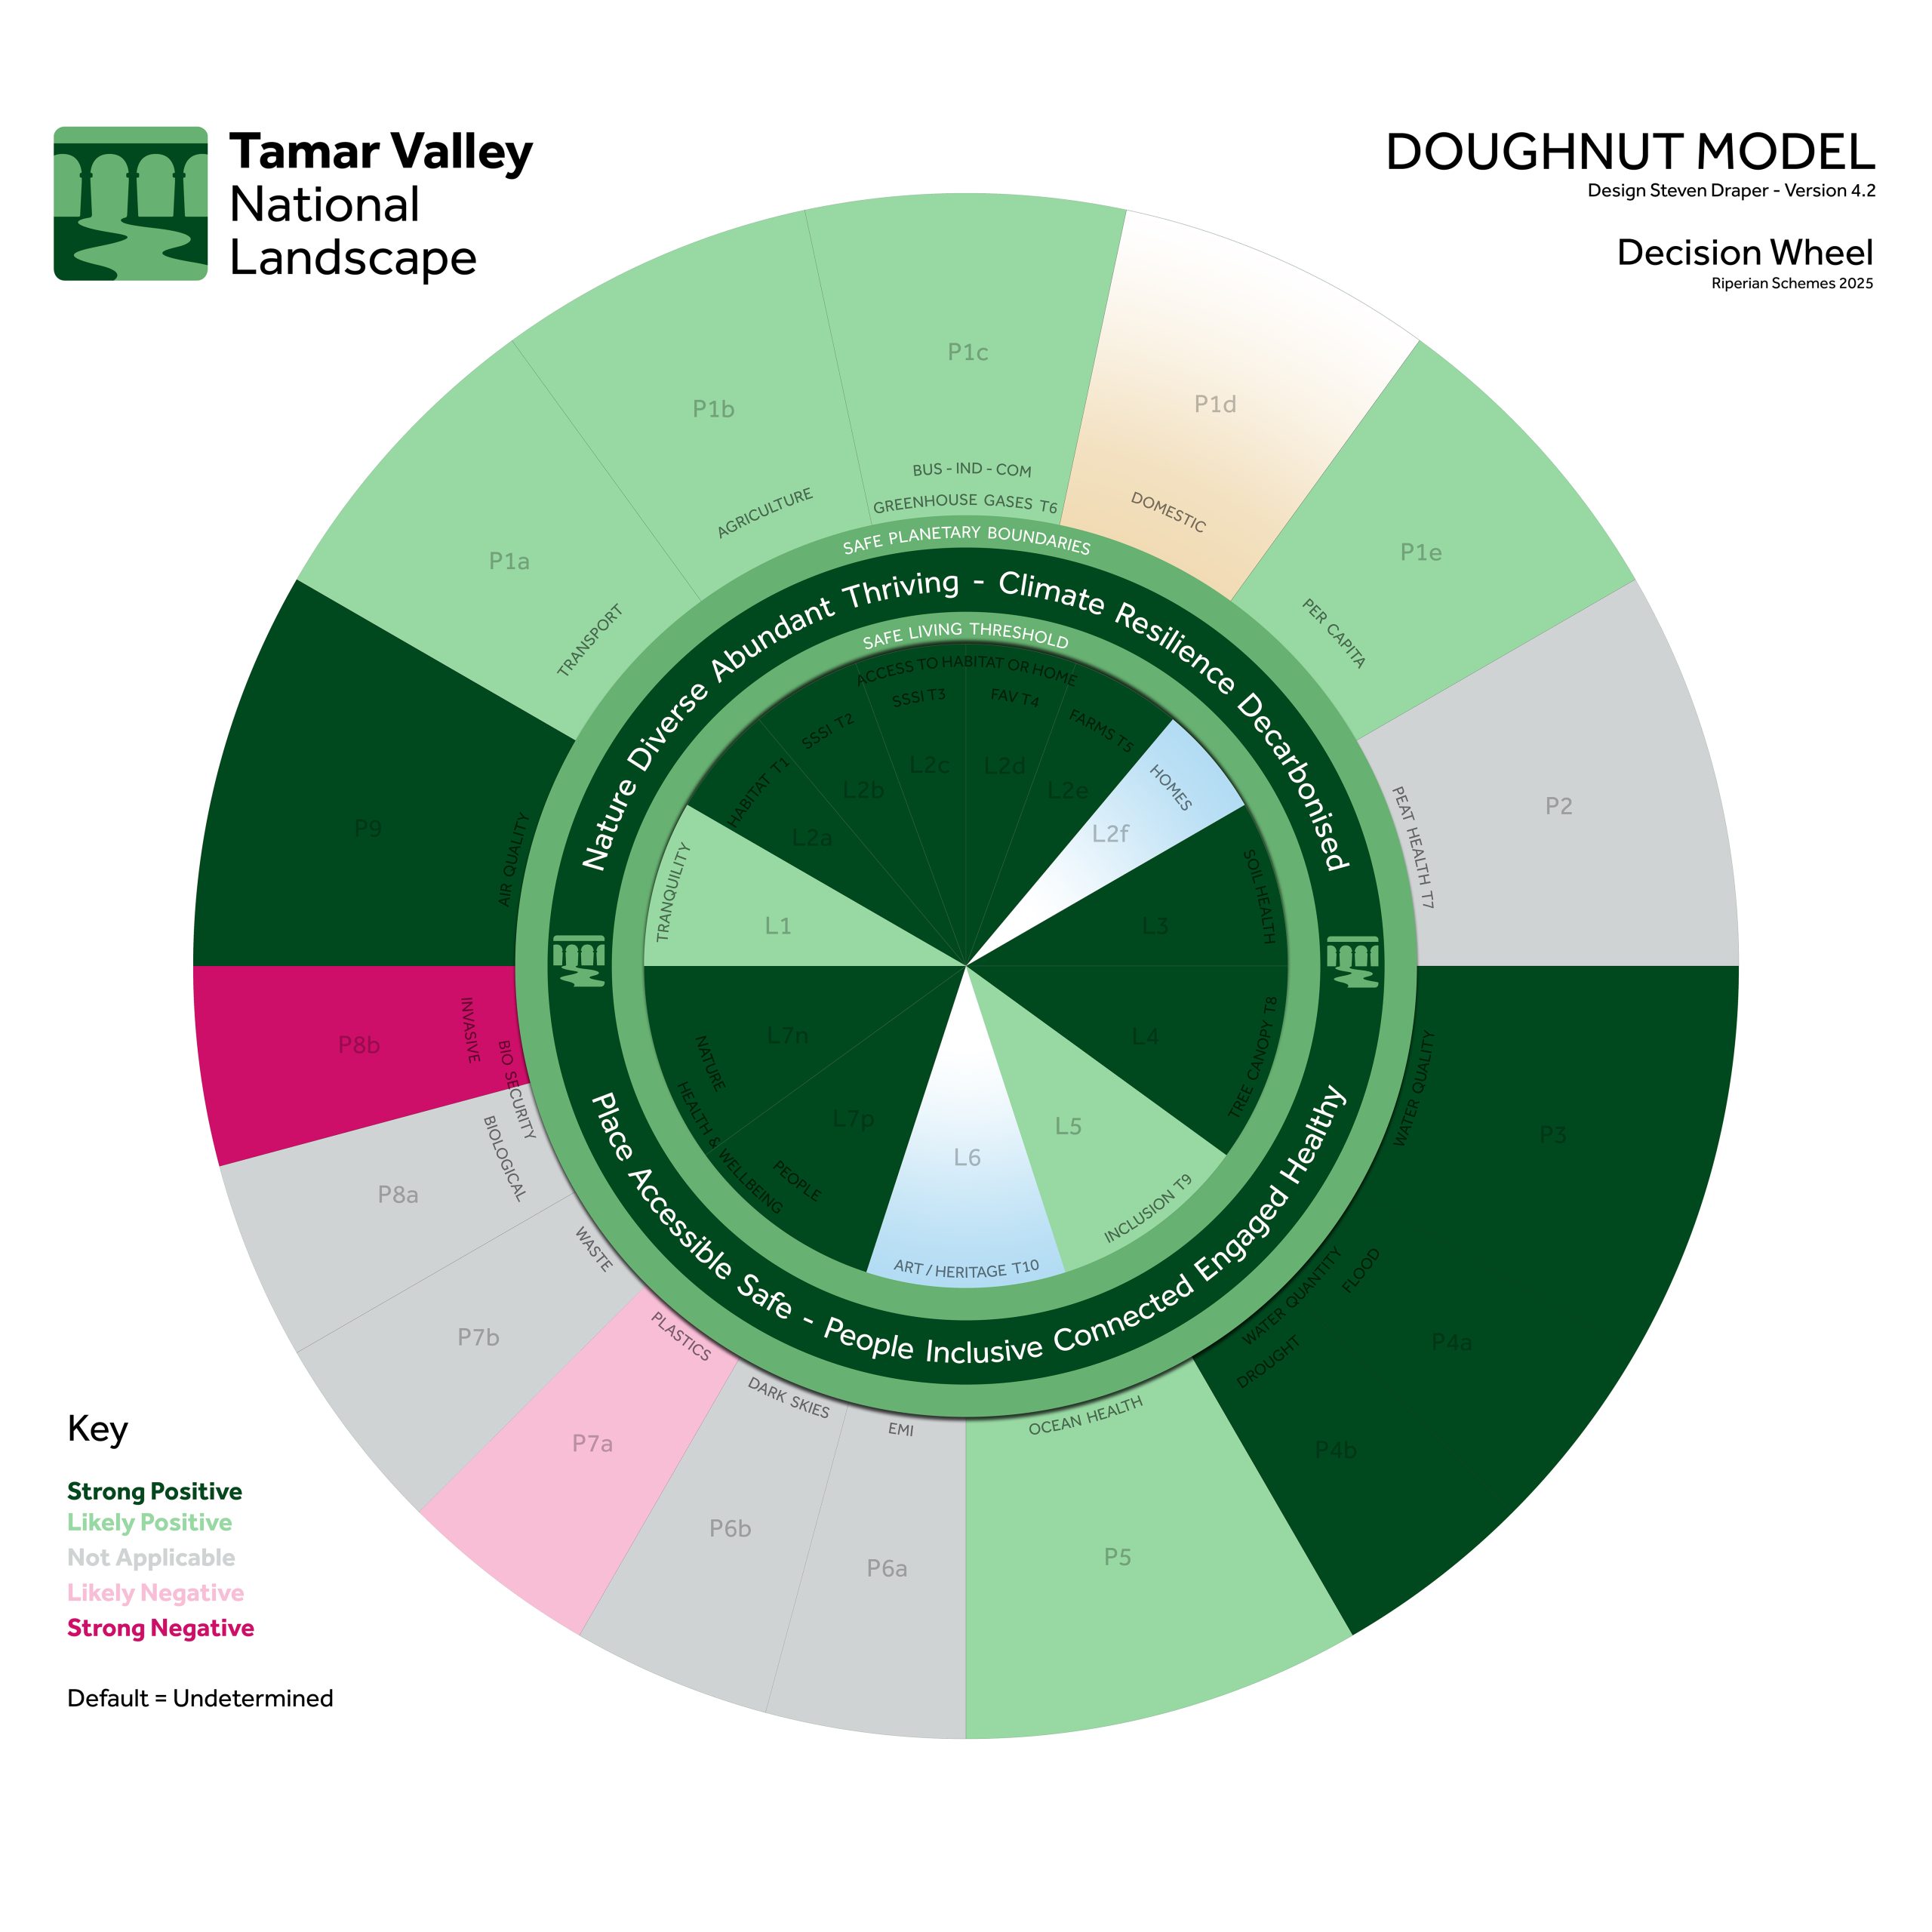
Even if we have not established the current value of shortfall, overshoot or safe value, we can still consider if a project or proposal impacts applicable sectors in a Positive, Negative way, or show as currently undetermined or Not Applicable.
The output of this exercise helps us better establish best value projects, where one intervention delivers multiple positive outcomes and ensures any negative impacts can be identified and mitigated as part of the project design.
In the example of Riperian projects, we see multiple Positives (Green) several areas that are not applicable, a couple where it’s not determinable (left as default) and two where mitigation measures would be needed (Magenta / Pink)
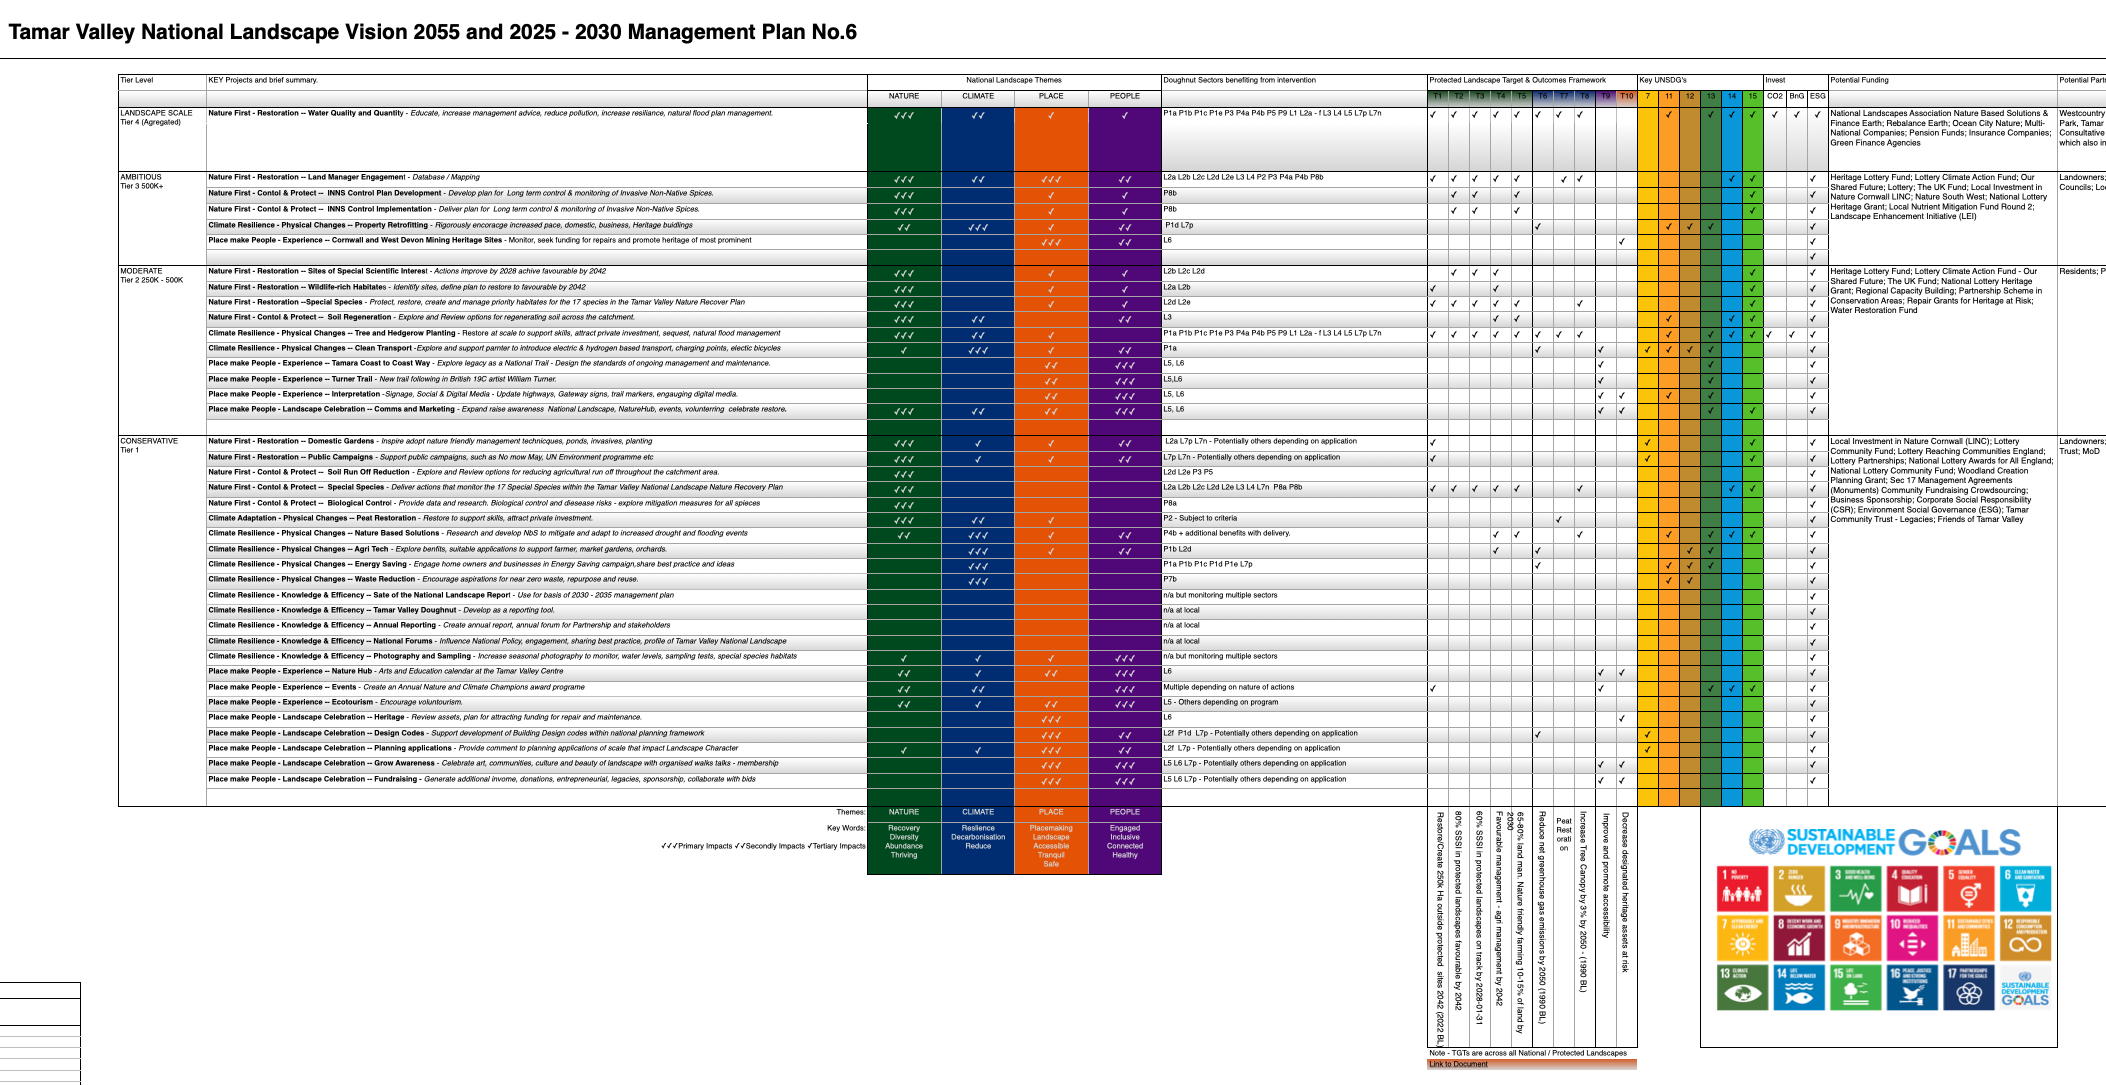
The Doughnut Matrix
is a spreadsheet that currently enables all Management plan 6 projects to cross reference with the PLTOF, Key UNSDG’s, NbS Investment and also details which doughnut sectors each project will benefit.
In addition, a National Landscape is often asked to provide comment on the plans of others. Our doughnut provides an efficient and consistent method for evaluating each proposal by considering the impact on each sector.
Phase 3 – As a monitoring tool (Underway)
Tracking Progress and evaluating success.
The doughnut can be used to monitor values of the individual sectors in various ways.
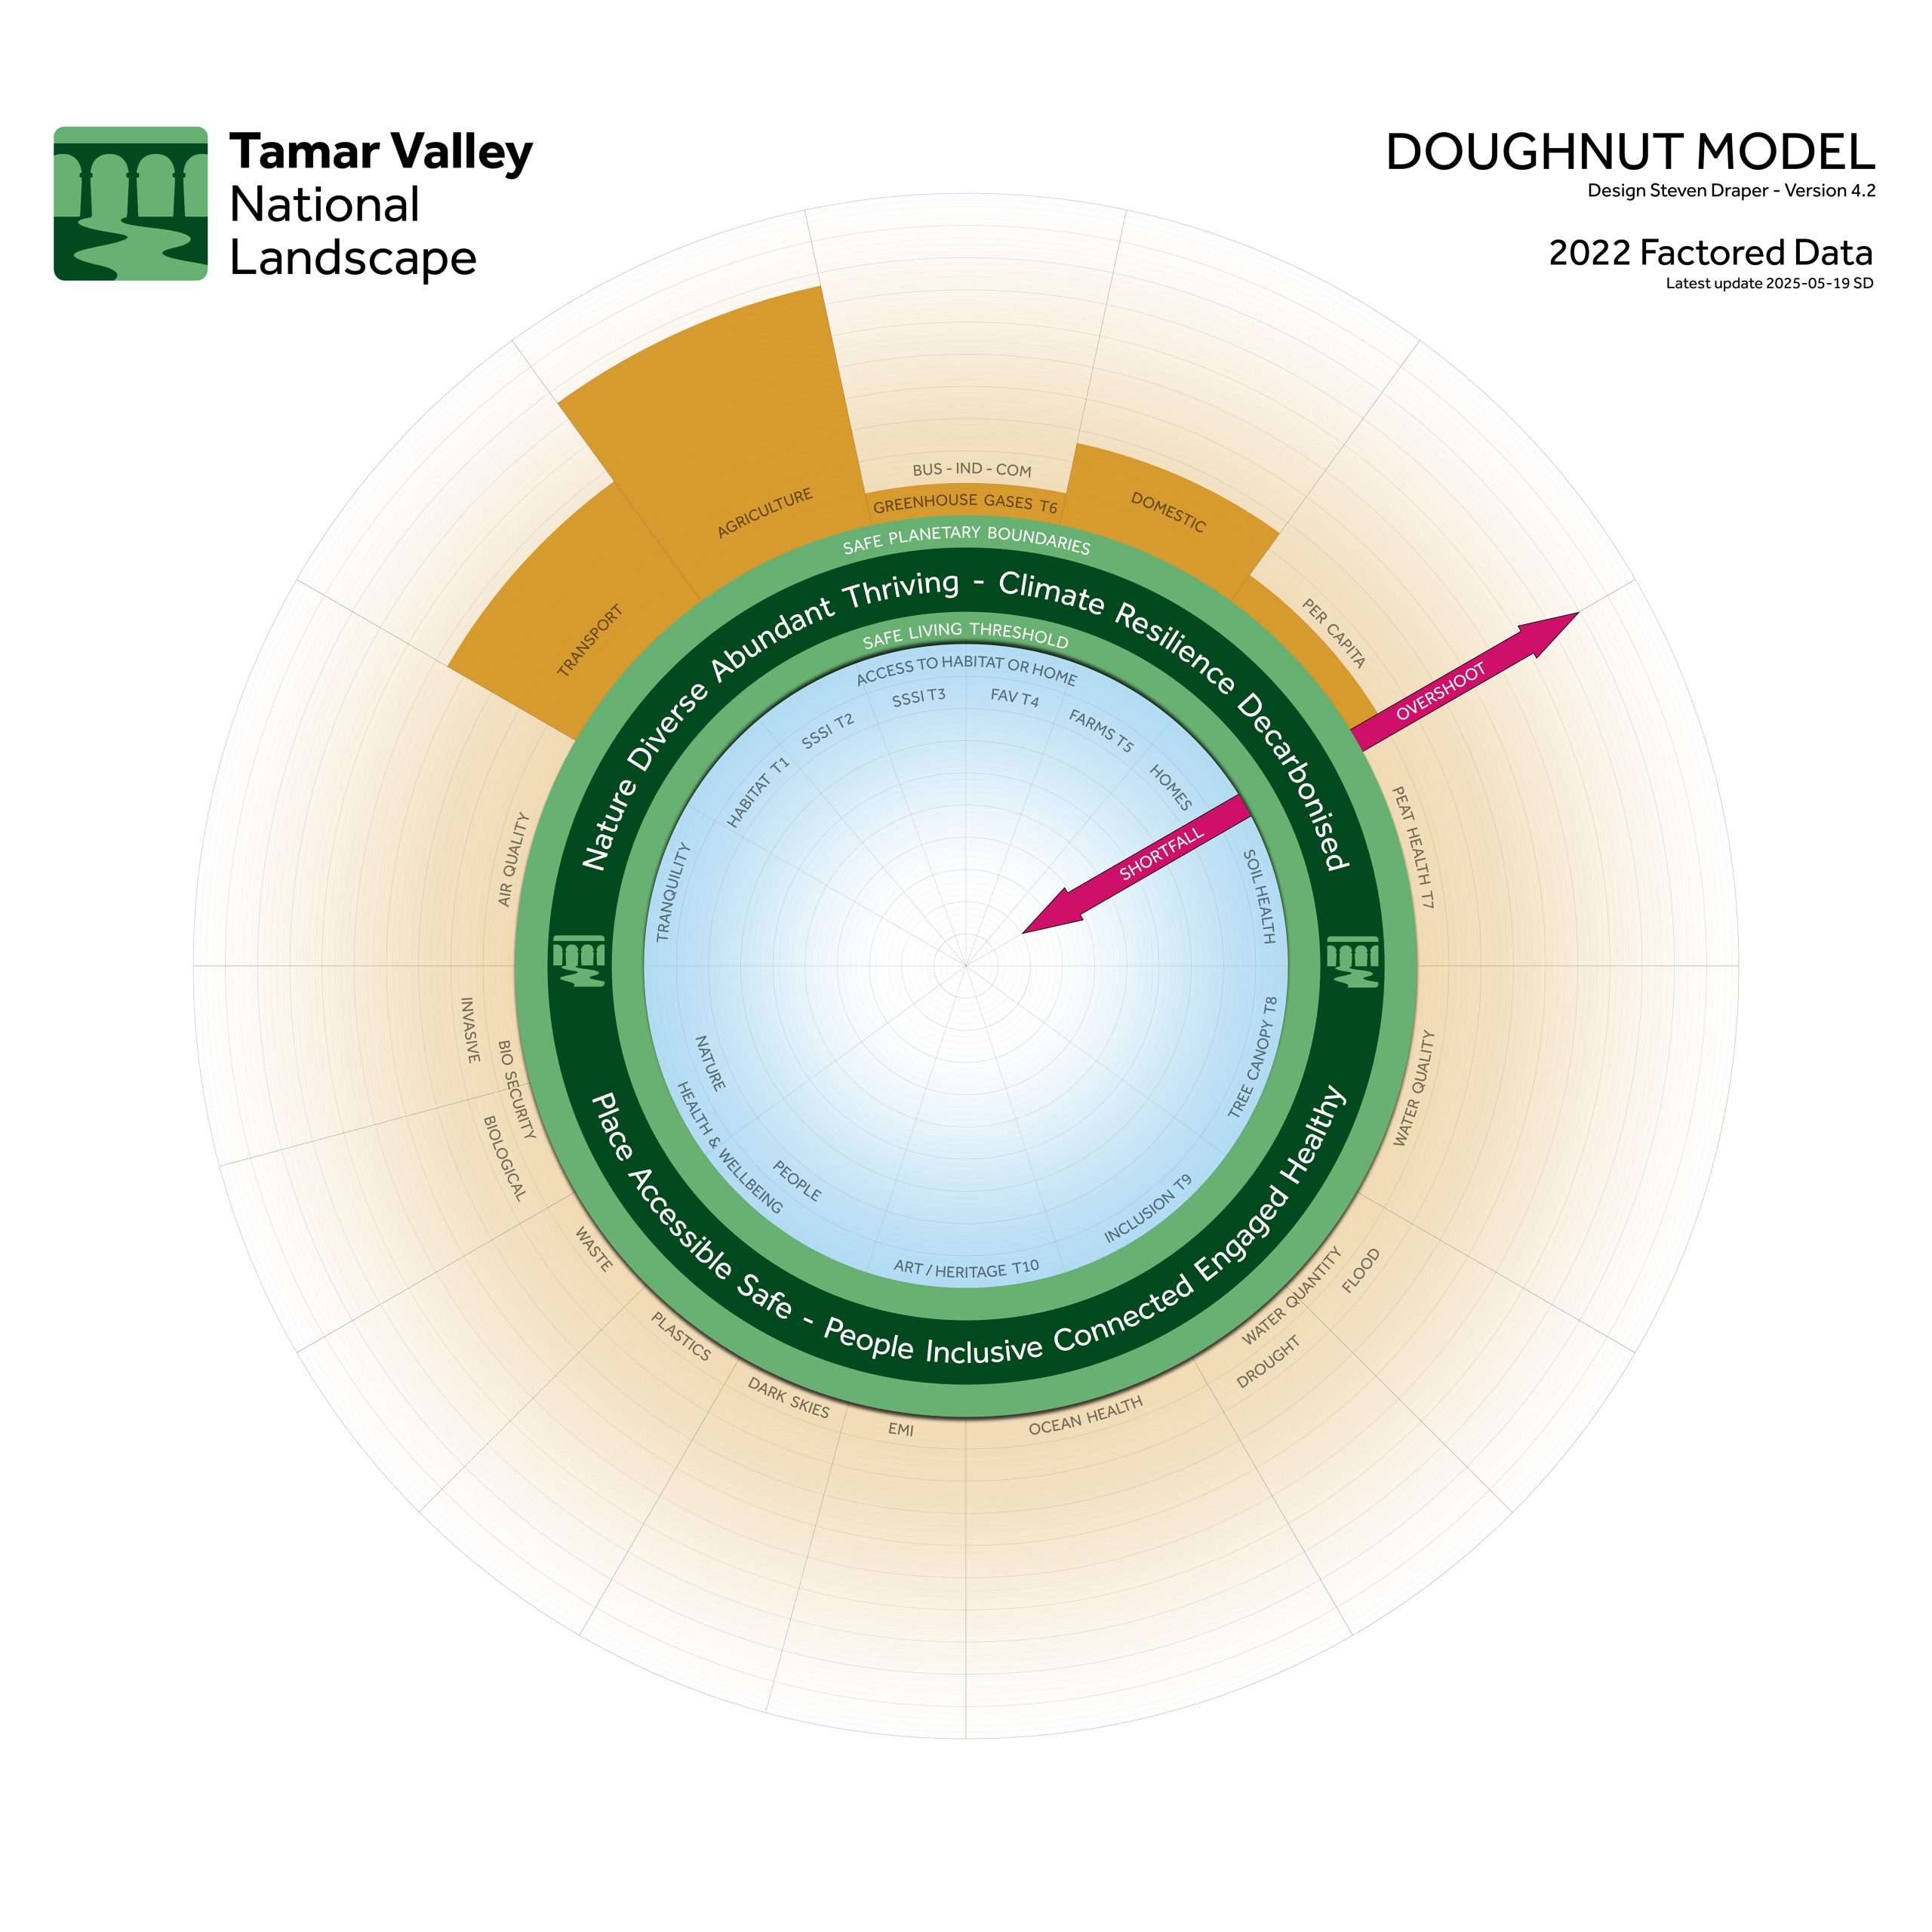
Metric monitoring – In this case each sector has a safe value established that would correspond to no shortfall or overshoot. The current value can then be plotted onto the doughnut.
We currently have data from Natural England for several sectors and are establishing safe vales for them. Other sectors will either use readily available data or we will work with universities to establish a suitable metric.
The size of the sectors indicates how we are doing in relation to where we want to be. The full details of each metric are documented in the Doughnut Appendix. The data can be used for evaluating projects against target outcomes.
Severity and Required Effort survey. By asking a panel of experts or stakeholders to rank the severity of shortfall or overshoot and effort needed to reach a position of safety we can plot the outcomes on all or selected doughnut sectors. This quickly provides an alternative ‘perceptive’ data set and is a common way doughnuts are used around the world.
Momentum – Sector values are rarely static. Even before any intentional interventions are made they will already be moving towards or away from safe. This momentum can be established by plotting results over time and provides the advantage of identifying priorities even further. A slowing of momentum can also identify natural resistance which would require more effort. Unexplained instability or acceleration might forewarn the approach of a system tipping point requiring urgent investigation and action.
Understanding momentum enables the additionality of an intervention to be considered rather than simply the change which enables a far better understanding of project success – for example in the case of a metric moving away from safe, slowing that momentum is a necessary part of stabilising before recovery. Without understanding momentum and additionality the intervention might be considered as a failure.
Phase 4 – As an impact modelling tool – Status = Future possibility
Futurescope.
In providing feedback, Dr Peter LeFort of Exter University and the Doughnut Economic Action Lab – suggested if reasonably accurate metrics could be established and economic values applied to them, then the Tamar Valley doughnut might be able to provide some form of economic modelling outputs on at least some sectors.
An important example would be where a positive intervention on one sector delivered a known negative move on another. If modelling was enabled various mitigation scenarios could be evaluated to determine a best cost solution.
This would be an incredibly powerful output, but at this point is beyond the scope without significant investment, academic studies and evaluation testing.
What Questions or Comments?